Understanding Projections
Climate change projections are a useful way to present climate change information. They show how the future climate might look relative to an observed baseline historical climate depending on different greenhouse gas and aerosol emissions scenarios.
Projections can be constructed by combining observed data and climate model data to generate application-ready data (see also step 5). The simple scaling of observations by changes from global climate model projections is an easy way to produce a projections dataset, and downscaling may also be used if it is available (see step 5).
It is important to remember that projections are not forecasts or predictions. A forecast or prediction aims to tell you exactly what the future will bring and when, while the purpose of projections is to provide a credible range of possibilities for the future.
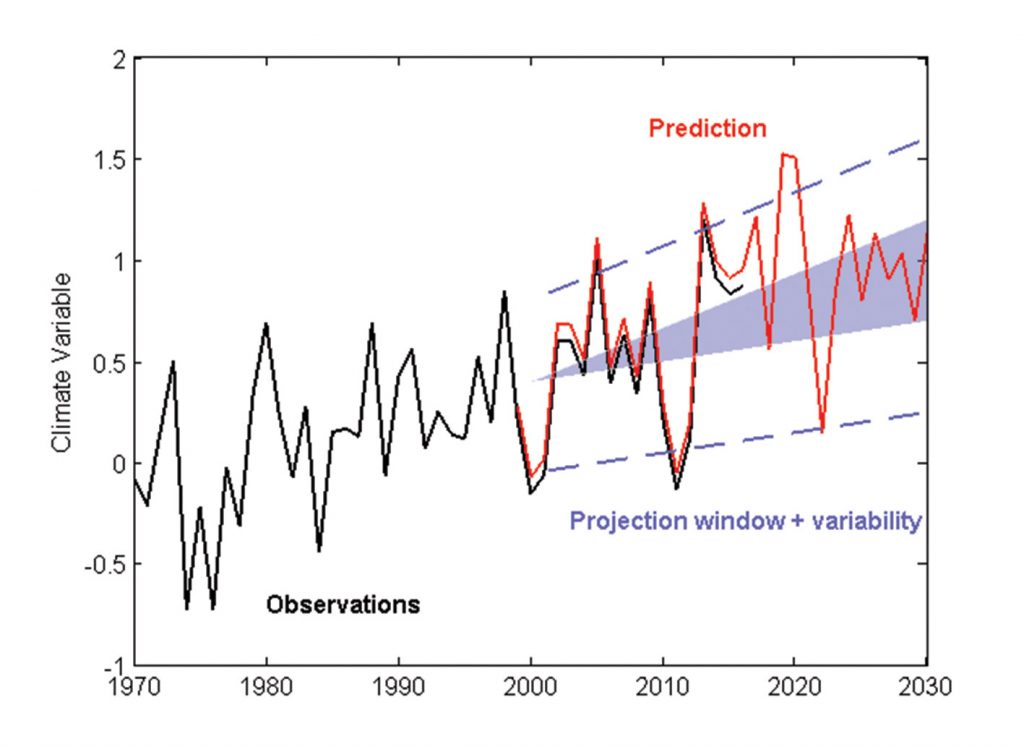
The following figure shows a hypothetical example of what projections look like, and what a prediction might look like for the same case. The projected range of change is the blue window, the range of projected change and the natural variability is dashed blue lines. The future values of the climate variable are likely to be in this window, but we don’t know what they will be year-to-year. If we could make a reliable prediction of the climate years into the future, it may look something like the red line – tracking the past observations and then producing a sequence of events into the future.

Without climate change projections, we would have to plan for almost every climate possibility for the future. Imagine if you had to plan for all the temperature possibilities from 10 °C cooler to 10 °C hotter than today, or where sea levels might be anywhere from 100 cm lower to 200 cm higher than today. It is very hard to make decisions that will be right for all these possibilities.
Using the latest climate science and modelling, climate projections can help us plan for a smaller range of options by narrowing down the range of possible future climates.
